Q-Flood

Quantum-Enhanced Flood Forecasting & Simulation as a Service

Understand flood risk before the water arrives.

Q-Flood by WaterMatica brings together weather forecasts, field observations, hydrological modelling, artificial intelligence and quantum computing research to assess where flooding may occur, how it could develop and which locations need attention.

Delivered as a service, Q-Flood transforms environmental data into flood maps, early-warning proposals, scenario simulations and decision intelligence for public authorities, infrastructure operators and risk professionals.

7Hydrology models
2D GPUHydraulic simulation
24 / 48 / 72hForecast outlooks
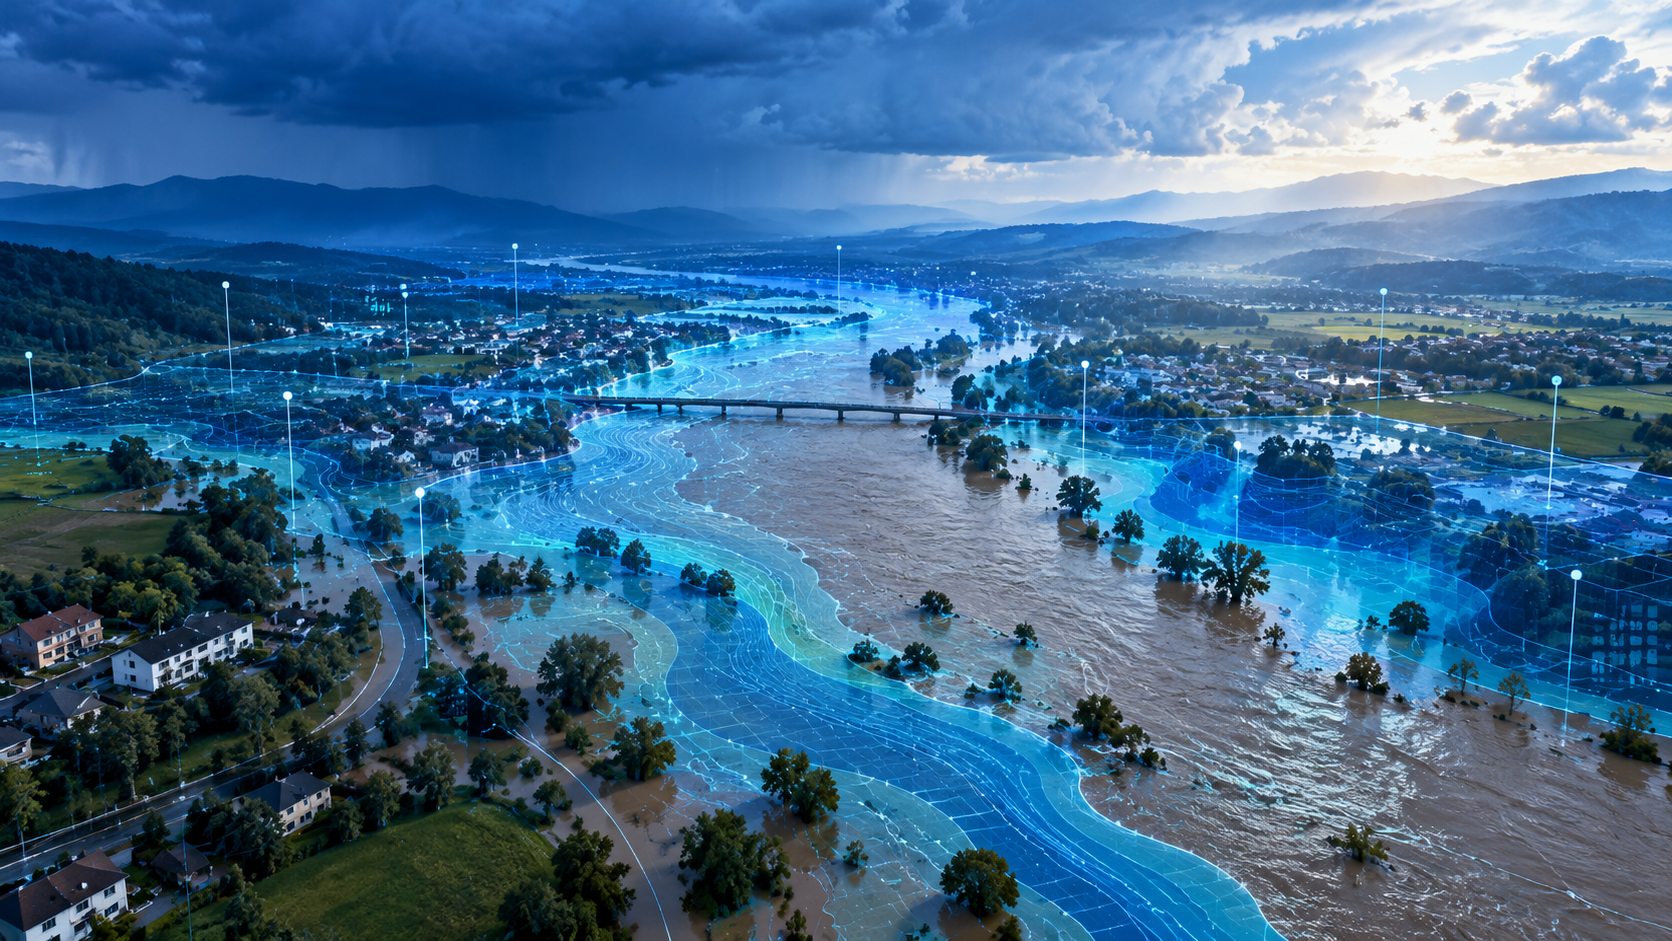
Q-Flood interactive flood map

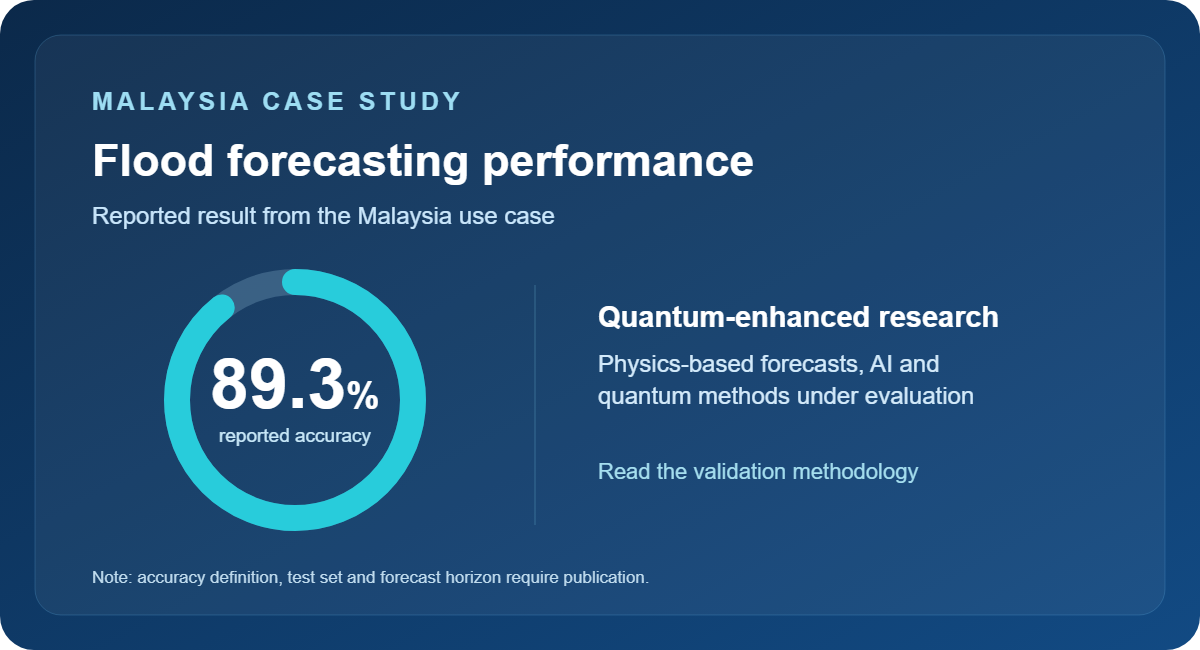
MALAYSIA CASE STUDY

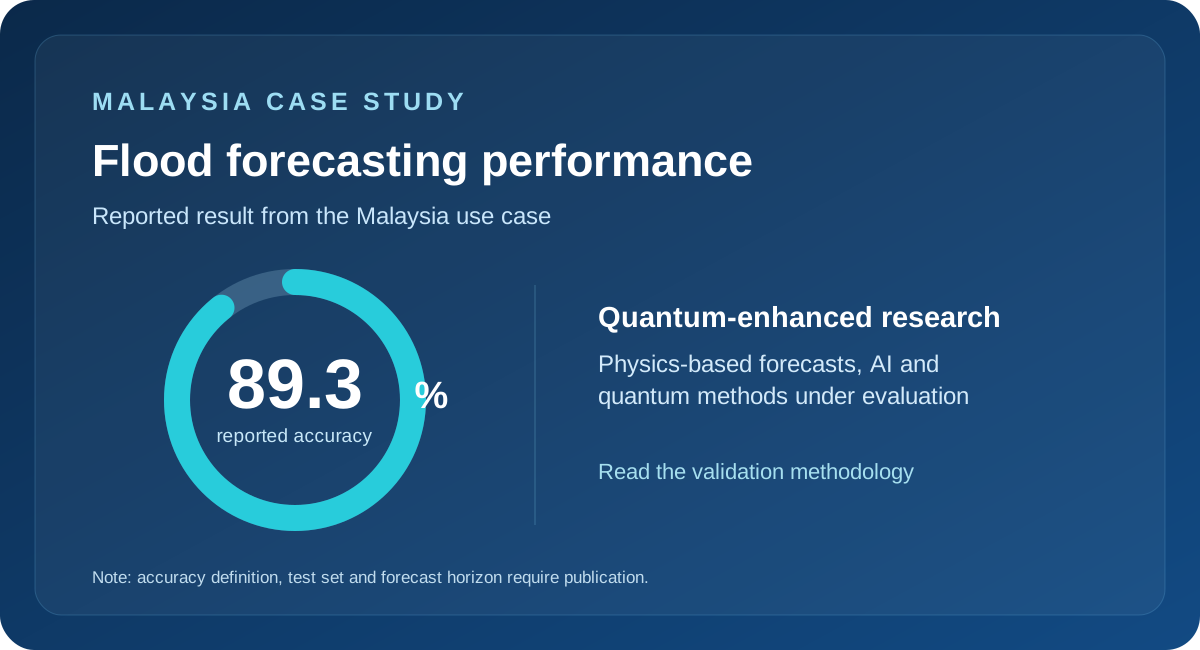
Malaysia flood forecasting: reported results

Q-Flood combines a physics-based forecasting engine with AI and a separate quantum research programme. The Malaysia project reports an 89.3% forecasting accuracy figure.

Malaysia use case — 89.3 percent reported forecasting accuracy; validation metric pending documentation.
Reported figure, not independently verified in the September 2026 MQFSE one-pager. Publish a named accuracy metric, evaluation period and forecast horizon alongside this claim.

Flood intelligence for everyday decisions and emergency planning

Flood preparedness requires more than a rainfall forecast. Teams need to understand how rain moves through a catchment, where rivers may overflow, how water spreads through urban areas and what this means for people and infrastructure.

Q-Flood connects these processes within a shared modelling environment. Its flood digital twin brings together terrain, river networks, soil conditions and available observations to represent the area being assessed. Hydrological and hydraulic models then simulate how water moves through that environment.

The results help teams assess potential impacts, prepare warnings and compare response options using a consistent set of maps and supporting evidence.

How Physics, AI and Quantum Computing Fit Together

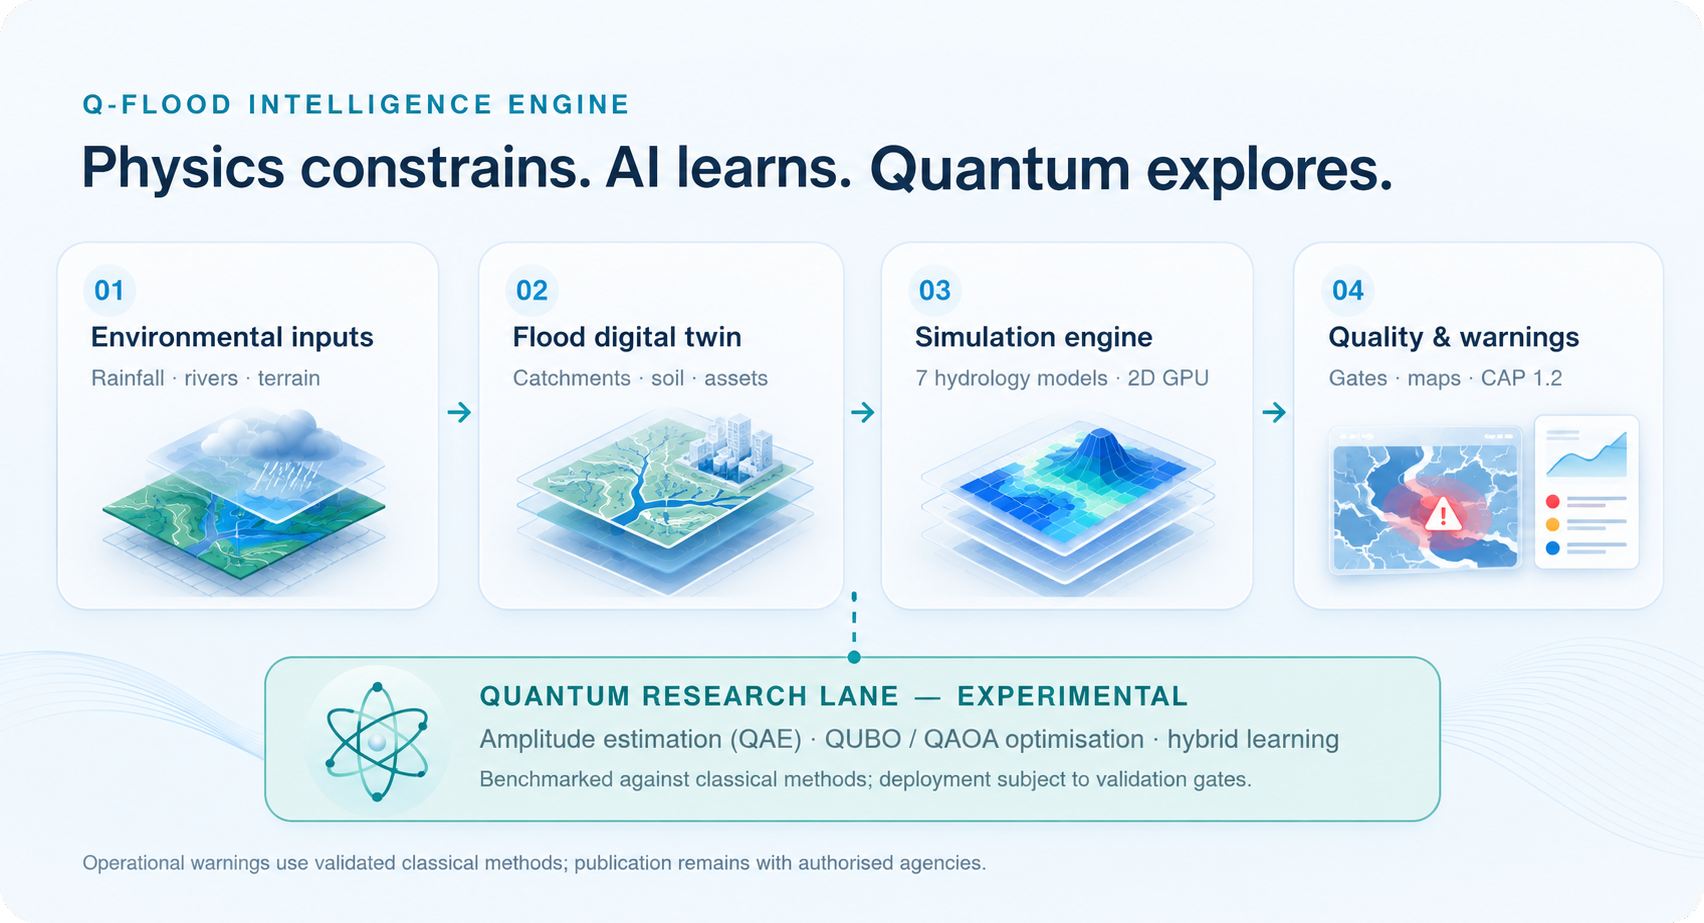
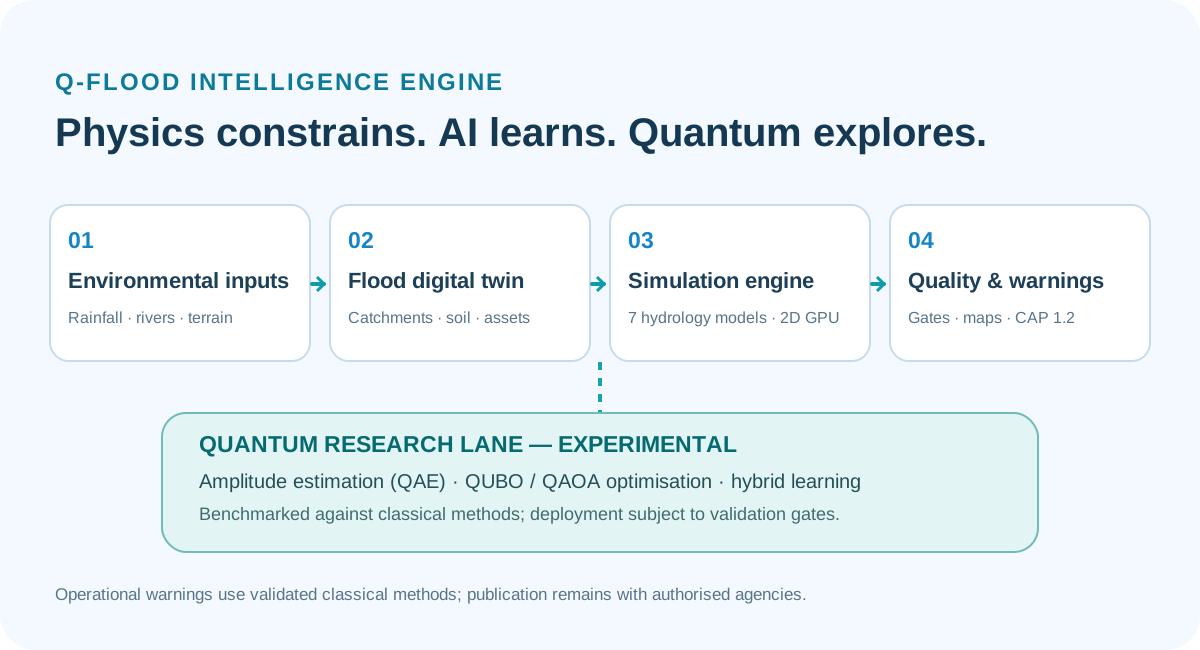
Q-Flood pairs extreme compute with deep intelligence. The operational modelling engine and the experimental quantum evaluation layer have distinct roles.

Q-Flood environmental data, digital twin, hydrology and GPU simulation, quality-controlled decisions, and experimental quantum research.

One solution for four connected needs

Flood Forecasting & Early Warning

Assess developing flood conditions using weather forecasts, rainfall observations, river levels and available sensor data.

Q-Flood produces flood hazard maps and structured warning proposals that help authorised teams review affected areas and potential impacts. Forecast outputs include uncertainty, giving operators context for their decisions.

Warning drafts support the Common Alerting Protocol, CAP 1.2, for integration into established warning workflows. Public warning approval and publication remain with the responsible authority.

Flood Simulation & Planning

Explore how a catchment, city or vulnerable site could respond to different rainfall, river-flow and coastal boundary conditions.

Replay historical floods, compare alternative scenarios and examine where water may accumulate or exceed critical depths. Scenario studies support preparedness exercises, drainage assessments and longer-term resilience planning.

Emergency Response Support

View flood extent, depth, flow speed and timing alongside roads, facilities and other relevant assets.

Q-Flood helps response teams identify potentially affected locations, assess access constraints and prioritise areas for further review. Shared maps and operational outputs support coordination between agencies and infrastructure operators.

Insurance & Financial Risk Analysis

Connect flood scenarios with exposure and vulnerability information to assess potential consequences.

Where suitable asset and damage data are available, Q-Flood supports analysis of flood exceedance probabilities and potential losses. These insights can inform insurance assessments, portfolio reviews and resilience investment decisions.

See how a flood could unfold

Q-Flood provides more than a single flood boundary. Its outputs describe the behaviour of water across the modelled area:

Flood extent

Where inundation is predicted.

Water depth

How deep floodwater may become.

Flow velocity

How quickly water may move.

Arrival time

When water may reach a location or threshold.

Flood duration

How long inundation may persist.

Hazard to people

Where depth and velocity create dangerous conditions.

Flood probability

How outcomes vary across simulated scenarios.

An interactive map allows users to explore individual locations, inspect hydrographs and follow changes in water depth over time. Exported viewers can also support offline review.

How Q-Flood works

1

Bring the available data together

Q-Flood combines terrain and land-cover information with weather forecasts, satellite rainfall, river observations and available telemetry.

The solution can incorporate WaterMatica sensors and existing monitoring networks, subject to data access and integration requirements. Data quality checks and source tracking help identify gaps and unreliable inputs.

2

Build the local flood model

Terrain, drainage paths, soil characteristics and river networks form the physical foundation of the model.

Available observations update soil and river conditions, while local gauge measurements help correct rainfall inputs. Each implementation is configured around the geography, data coverage and operational needs of the selected area.

3

Simulate water movement and uncertainty

Rainfall–runoff modelling estimates how rainfall becomes surface flow. Coupled one-dimensional river and two-dimensional flood models simulate how that water moves through channels and across surrounding land.

Ensemble scenarios explore variations in rainfall and inflow, helping users understand a range of possible outcomes.

In parallel, experimental quantum methods evaluate selected probability-estimation and optimisation tasks; they are not a prerequisite for operational warnings.

4

Check results before release

Each run passes through a plausibility gate that checks water balance, depth, velocity and numerical stability.

Runs that fail these checks are held with a recorded explanation. Each output includes a run record documenting its data sources, configuration and quality checks.

5

Deliver maps and decision support

Results are available through interactive maps, GIS-compatible files, hydrographs and structured alert drafts.

Teams can review the outputs within their own workflows and use them to support planning, operational coordination and authorised warning decisions.

Built to work with your existing systems

Q-Flood complements existing meteorological, hydrological and emergency-management workflows.

Standard outputs make results accessible to analysts and operational teams:

GeoTIFF for flood depth, velocity, timing and hazard layers.

GeoJSON for flood boundaries and hazard polygons.

CSV for hydrographs and time-series analysis.

CAP 1.2 for structured warning drafts.

Interactive maps and run records for visual review and traceability.

Integration scope is defined around your data feeds, GIS environment and warning procedures.

A service configured around your area

A Q-Flood engagement starts with the area you need to understand and the decisions you need to support.

Together, we define the available data, modelling resolution, forecast horizons, update frequency and required outputs. Historical events provide a basis for evaluation before expanding into operational use.

Deployment options include cloud, on-premises and restricted-network environments. Hosting and external compute access are selected according to your organisation’s data policies.

The architecture supports a staged path from selected sites or catchments to broader regional coverage. Larger deployments require infrastructure sizing and performance validation for the agreed service scope.

Quantum Computing & Advanced Flood Intelligence

Validated hydrological models, a two-dimensional GPU hydraulic solver delivering extreme compute and machine-learning methods adding deep intelligence provide Q-Flood’s core flood simulations and operational warning proposals.

Quantum algorithms are evaluated in parallel for flood exceedance probabilities, response optimisation and rainfall–runoff learning. Each approach is benchmarked against a classical reference using matched data and documented tests.

Quantum methods are at experimental-validation stage. They are introduced to operational workflows only after meeting quality, reliability and performance gates; warnings currently do not rely on quantum hardware.

Quantum Research: What Has Been Measured?

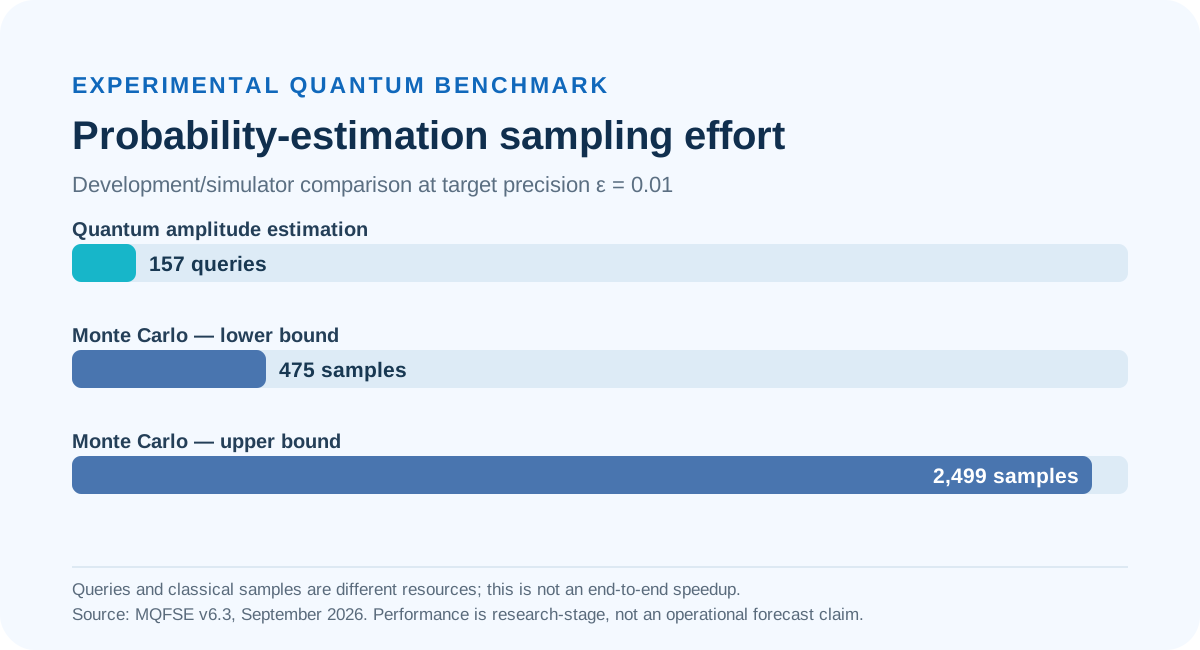
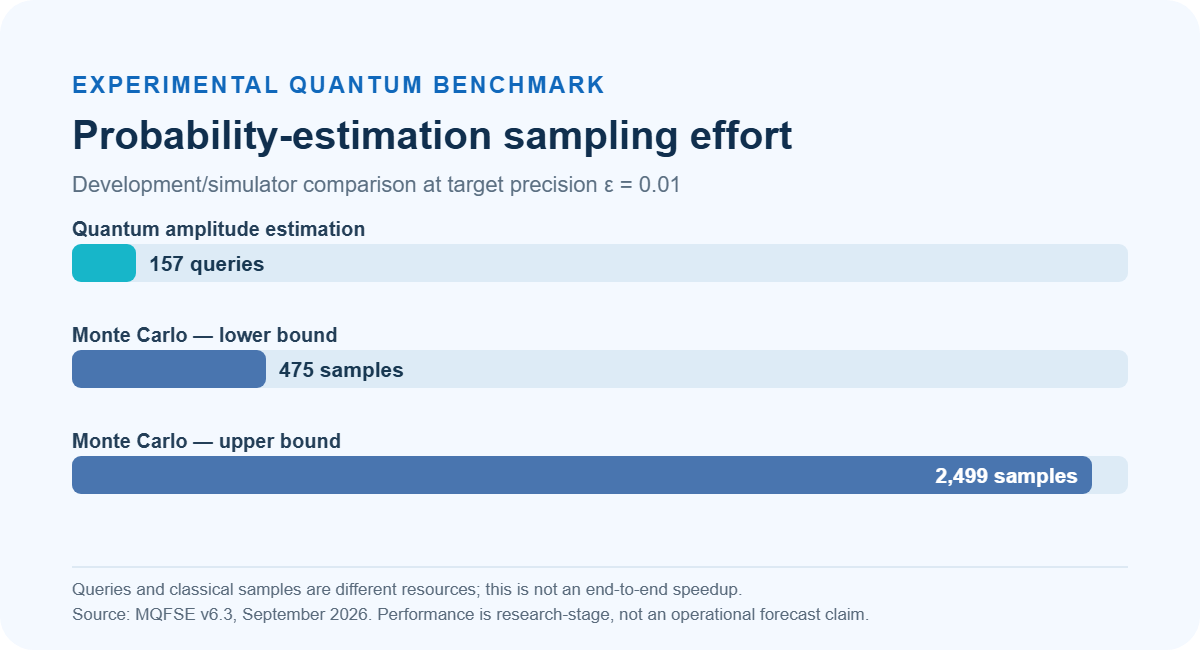
A development benchmark compares quantum amplitude-estimation queries with classical Monte Carlo samples for a flood-risk probability task. The figures demonstrate algorithmic research, not measured end-to-end forecast acceleration.

Quantum amplitude estimation 157 queries, classical Monte Carlo 475 to 2499 samples in a research benchmark at epsilon 0.01.
Algorithmic effort only. Query/sample counts are different computational resources; no quantum hardware runtime advantage is claimed.
View comparative quantum / classical research results

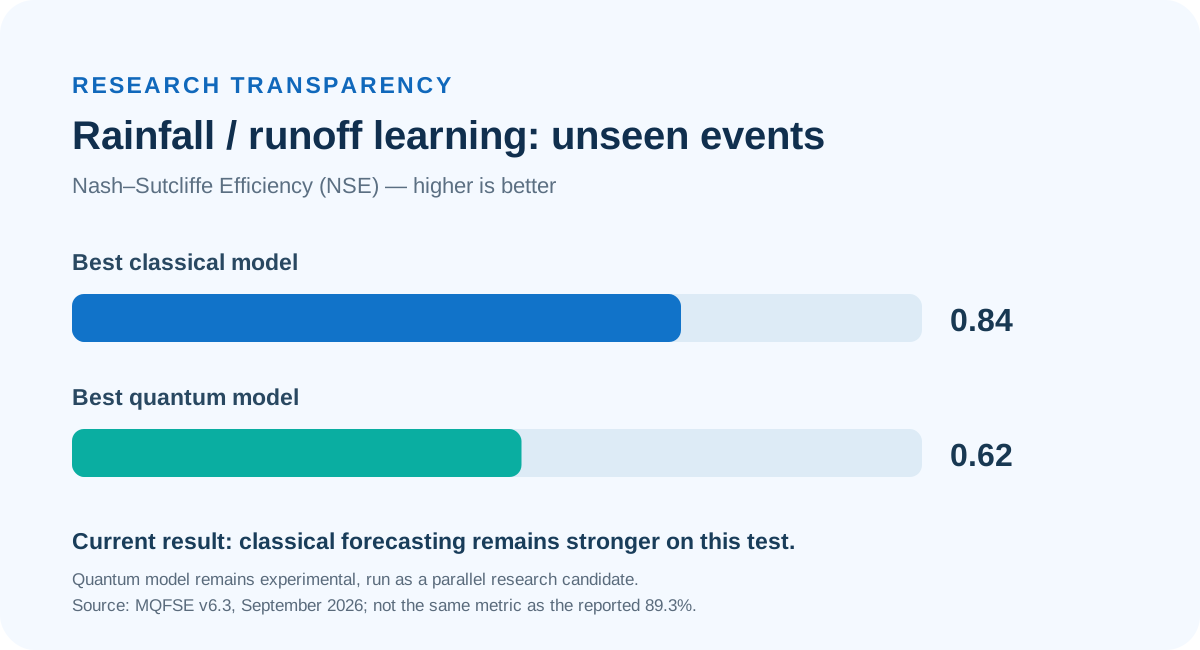
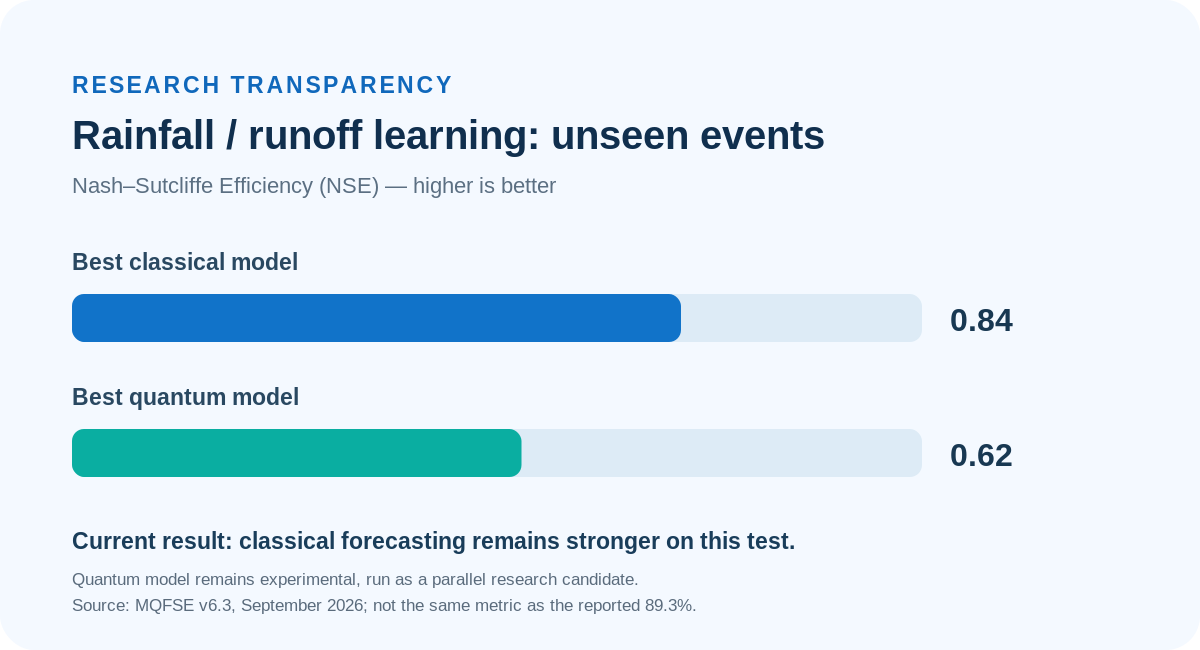
The reported experimental forecast-modelling benchmark on previously unseen events favours the classical baseline (NSE 0.84 versus 0.62 for the best quantum model). Higher NSE indicates better skill. Quantum learning remains a research track.

NSE skill on unseen events: classical 0.84; quantum research model 0.62; higher is better.
Separate test and separate metric from the reported 89.3% Malaysia result. Source: MQFSE v6.3, September 2026.

Malaysia Case Study — Forecasting Performance

Q-Flood’s Malaysia research includes historic flood simulations for Kelantan 2014 and the Klang Valley 2021, with model outputs assessed against available observations.

The project reports 89.3% forecasting accuracy for a Malaysia use case. The public case study should identify the exact metric, validation period, forecast horizon, sample size and source of observed outcomes before this figure is treated as verified.

Every new deployment requires local validation. Rainfall quality, terrain resolution, monitoring coverage and the intended forecast horizon influence how results should be interpreted.

What the 89.3% result means

89.3% is the forecasting accuracy reported by the Malaysia project team. The source one-pager does not define the accuracy metric. Before treating it as independently verified performance, the published technical note should identify the event set, measurement definition, forecast lead time and observation source.

Technical distinction: The 89.3% figure is not evidence that quantum computing improves forecast accuracy. In the September 2026 evaluation, quantum forecasting methods are being benchmarked against established classical models.

Who Q-Flood serves

Public authorities and emergency-management agencies

Support warning preparation, situational awareness and coordinated flood response.

Municipalities and urban planners

Assess flood-prone areas and compare scenarios for drainage and resilience planning.

Water utilities and infrastructure operators

Evaluate exposure around facilities, river corridors and critical access routes.

Insurers and risk analysts

Explore flood scenarios and potential losses using relevant exposure and vulnerability data.

See What Q-Flood Can Predict in Your Area

Start with a catchment, municipality or critical site. WaterMatica can configure the digital twin, agree measurable evaluation criteria and compare Q-Flood results against local flood records.

Request a demonstration or discuss a locally validated pilot.